Analyzing AR and PSMA co-expression to identify ADC targetable subsets in prostate cancer
Characterizing AR and PSMA expression reveals alternative ADC targets in prostate cancer
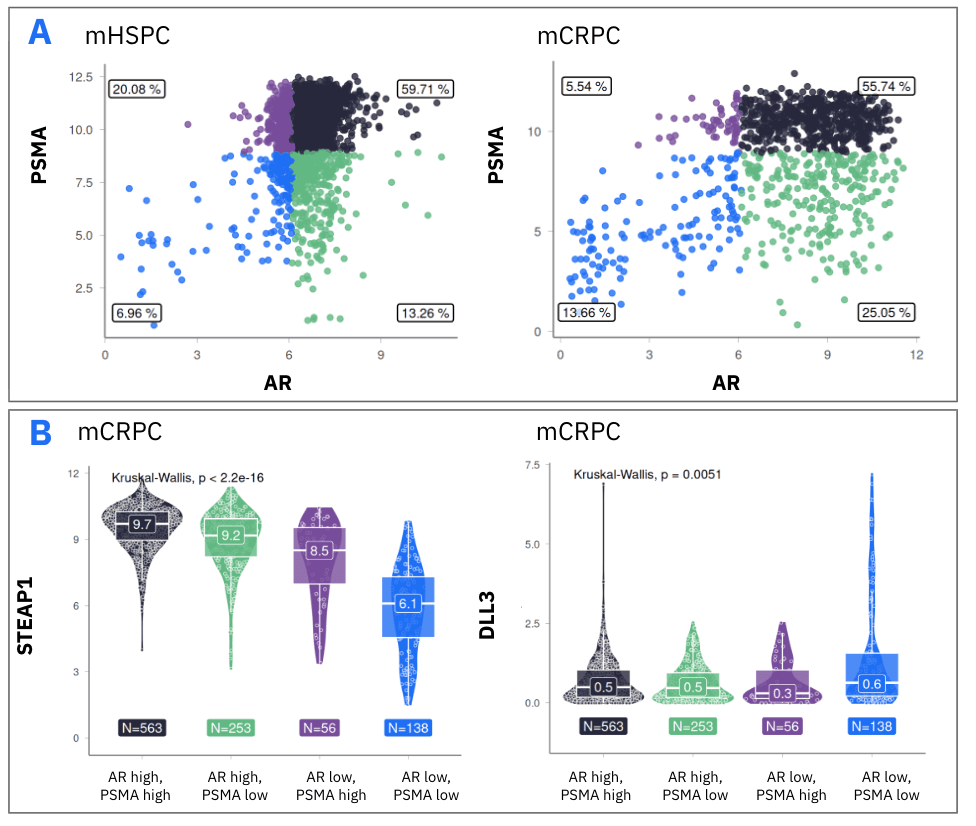
Figure 1. (A) Scatterplot of AR and PSMA expression in mCRPC and mHSPC biopsies. Dots are colored by co-expression groups. (B) Boxplots for STEAP1 and DLL3 expression by AR-PSMA co-expression groups in mCRPC biopsies. 25th percentile expression from pre-treatment was used to define High-/Low- gene expression.
 Lens Library

