Characterizing B7-H4 co-expression and PD-L1 prevalence in platinum-resistant ovarian cancer
Multimodal analysis reveals alternative ADC target co-expression patterns in PROC
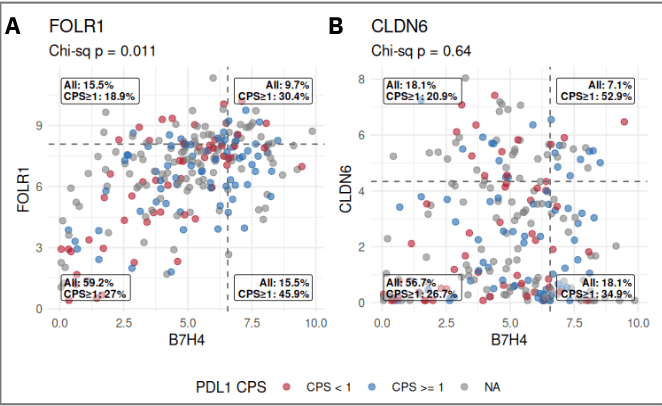
Figure 1. Scatterplots showing expression of B7-H4 vs (A) FOLR1 and (B) CLDN6 expression in PROC. Points are colored by PDL1 CPS status. Dashed lines represent the 75th percentile expression. Top percentage (All) displays fraction of total cohort in quadrant; bottom percentage (CPS>=1) displays fraction of samples with PDL1 CPS >= 1 in quadrant, with NAs included.
 Lens Library

