ESR1 mutations and copy number loss in breast cancer
Enrichment of ESR1 mutations in copy number loss states reveals new resistance patterns
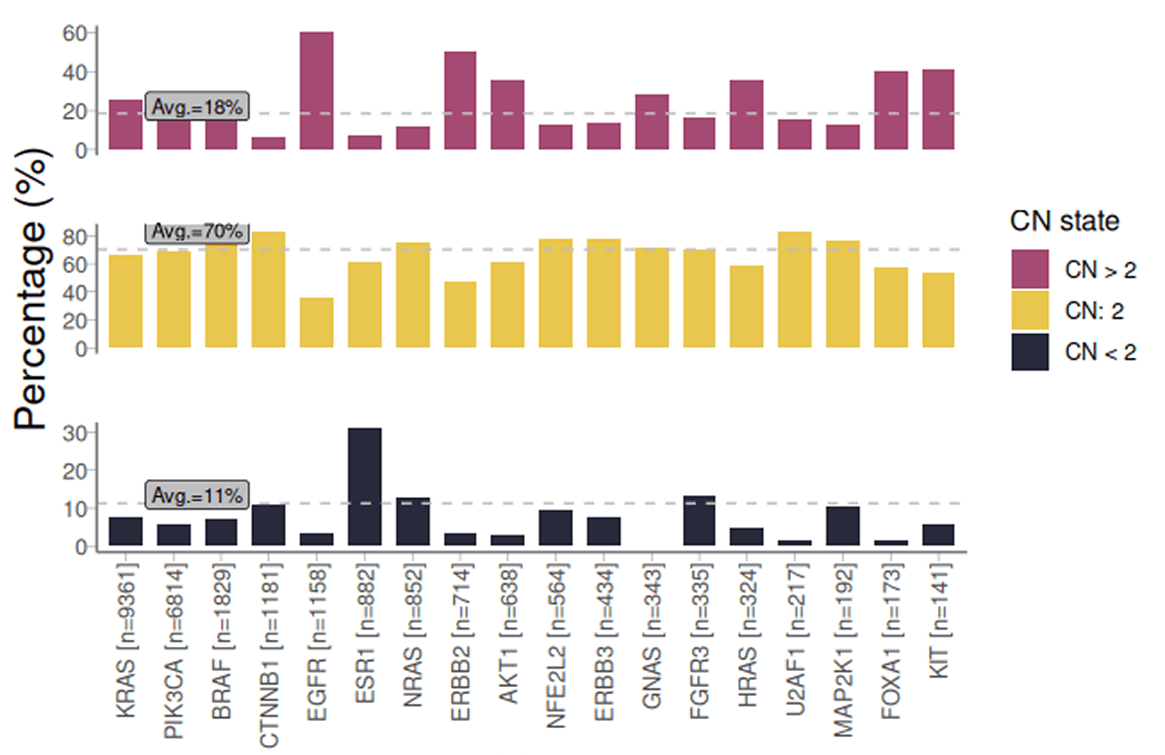
Distribution of CN states for genes frequently affected by GOF mutations among patients with GOF mutations in Tempus’ database and across solid tumors. Each bar represents the percentage of samples with a given CN state (CN < 2, CN = 2, CN > 2) for each gene, with genes ordered by prevalence of GOF mutations (at least 100 samples per gene). Average percentages for each CN state are indicated.
 Lens Library

