Immune profile score distribution in HPV16-positive and negative HNSCC
Analysis reveals how IPS and PD-L1 status drive immunotherapy response in HNSCC
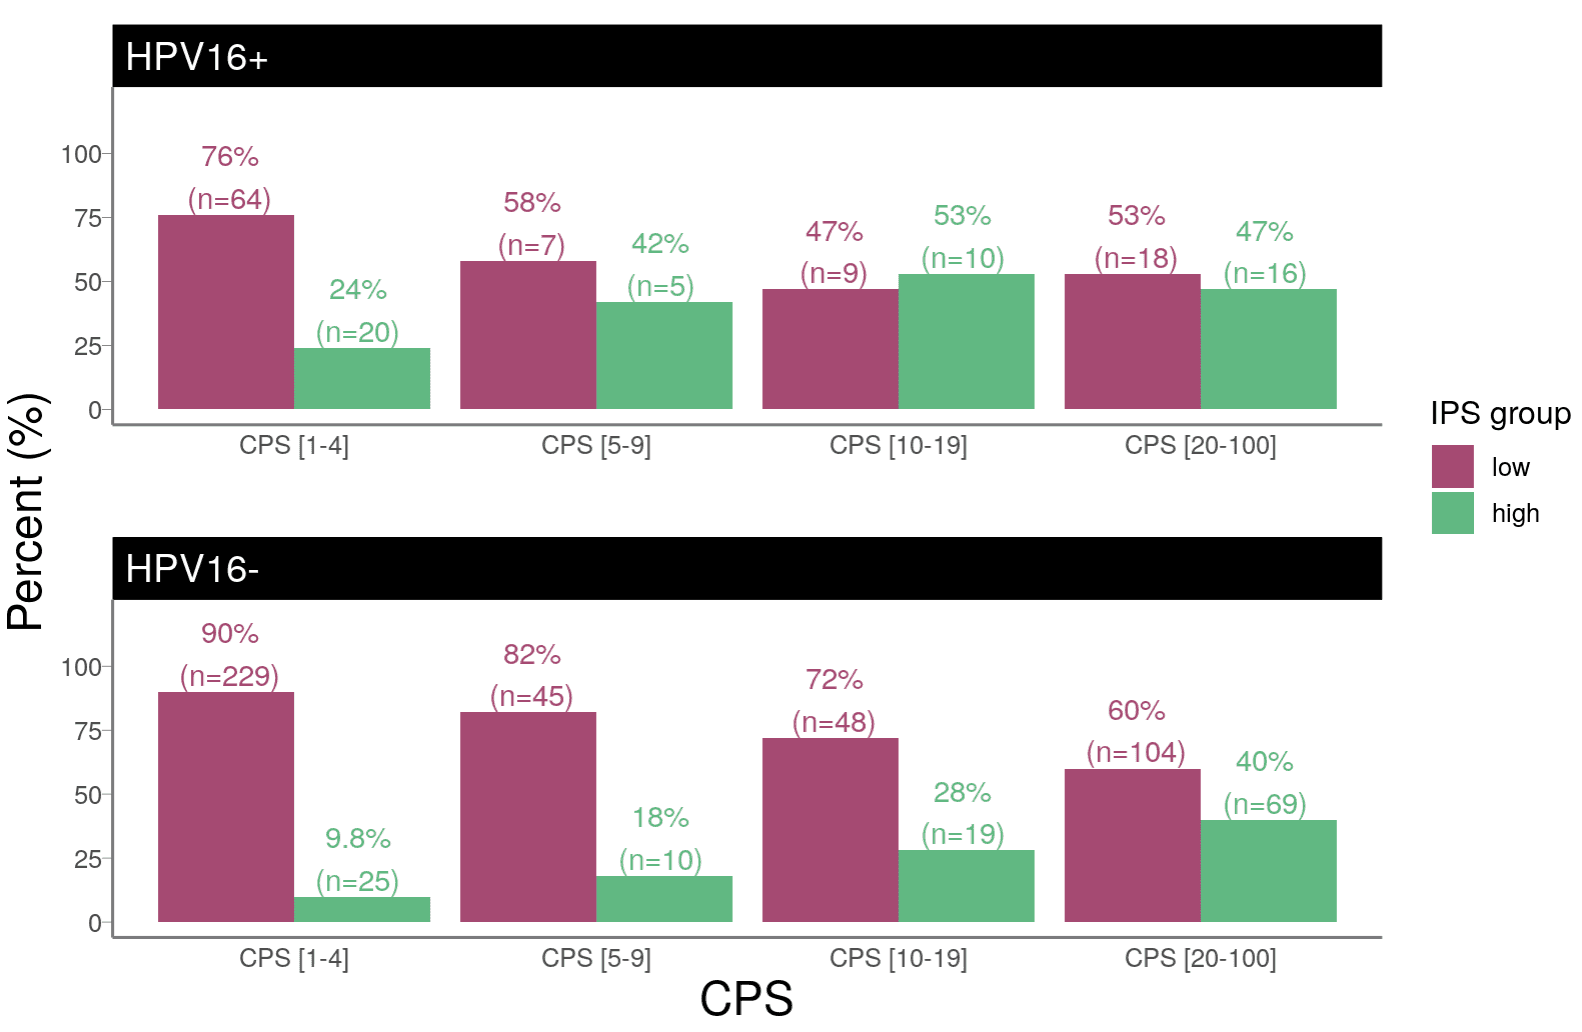
Barplot with percentage (y-axis) of high and low IPS in HPV16+/- HNSCC samples across different ranges of PD-L1 expression proportion (CPS) values (x-axis). The bars are color-coded to indicate the IPS group: low (red) and high IPS (green). Numbers above each bar indicate percentage and number of patients in each category. Samples with CPS < 1 (n=3) have been removed from this plot.
 Lens Library

