SSTR2 and GRPR co-expression profiling in neuroendocrine neoplasms and small cell lung carcinoma
Co-expression mapping reveals targetable subsets and distinct genomic drivers in NENs and SCLC
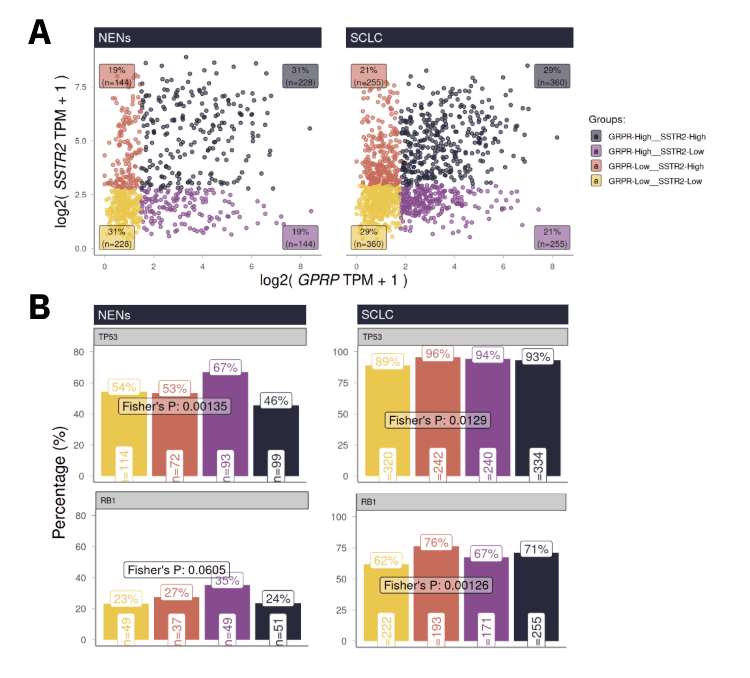
Figure 1. A) SSTR2 and GRPR co-expression scatter plot in NENs and SCLC. Each point represents a sample, color-coded by co-expression group. B) Co-expression fractions with alterations in specific genomic drivers (significance by Fisher’s p-values).
 Lens Library

