Transcriptomic profiles of treatment resistance in 1L mCRC
Uncovering gene expression changes and potential resistance mechanisms to BRAFi in CRC
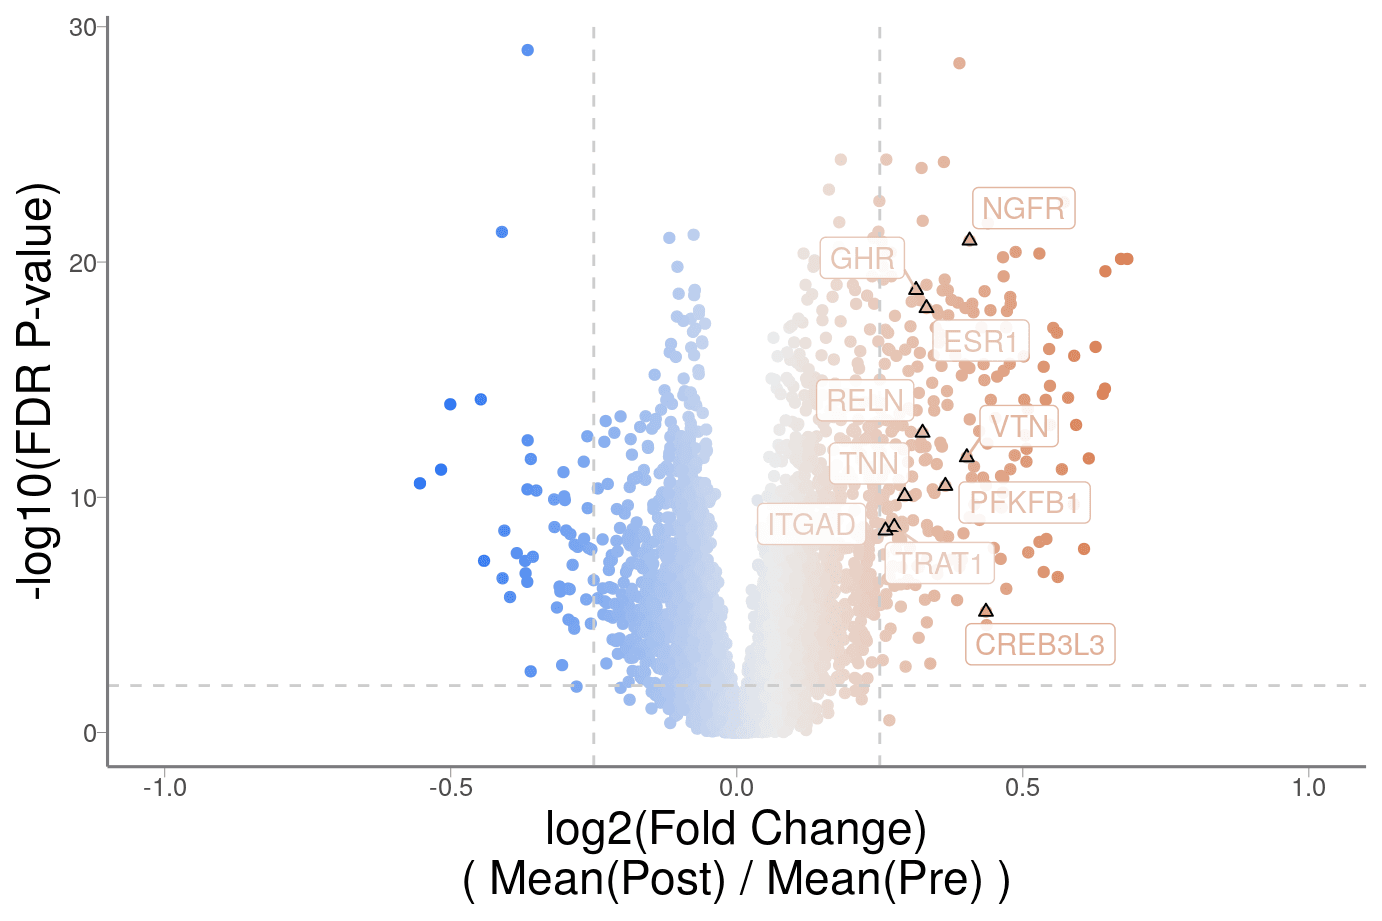
Volcano plot with differential gene expression results comparing pre- and post-treated biopsies from patients with CRC, treated with chemotherapy alone in 1L (by Wilcoxon rank-sum test). Highlighted genes are related to PI3K pathway*. Dots in orange represent genes enriched in post-treated samples, and blue-colored dots represent enrichment in pre-treated samples.
*curated canonical GSEA set
 Lens Library

