-
PROVIDERS
New MRD Medicare Coverage for Select Indications*
*When coverage criteria are met. Additional criteria and exceptions for coverage may apply.
-
LIFE SCIENCES
Register now
UPCOMING WEBINARTranslating data into an actionable R&D strategy
-
PATIENTS
It's About Time
View the Tempus vision.
- RESOURCES
-
ABOUT US
View Job Postings
We’re looking for people who can change the world.
- INVESTORS
01/05/2026
Genomic Profiling of Epithelial Neoplasms of the Appendix: Insights Across Histological Subtypes and Histological Grades
ASCO GI 2026
PRESENTATION
Authors
Michael J. Overman, Yingying Yu, Andreana Natalie Holowatyj, Saikat Chowdhury, Kanwal Pratap Singh Raghav, Anjali Vinocha, Paul F. Mansfield, Beth A Helmink, Saif Nirzhor, Michael White, Matina Fragkogianni, John Paul Y.C. Shen
Background: The biological behavior of appendiceal epithelial neoplasms (AENs) depends on histological subtype and grade. Due to their rarity, previous molecular analyses have grouped diverse biological types together. We aimed to examine genomic and outcomes differences among distinct biological subgroups of appendiceal cancer.
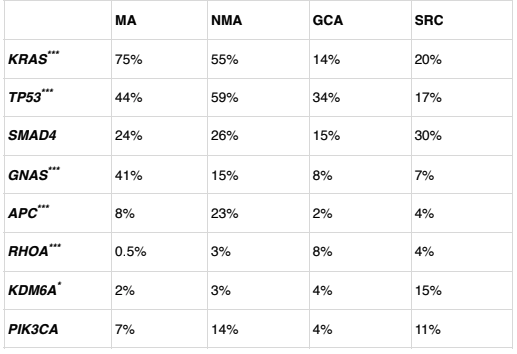
Methods: Tempus Lens was used to analyze de-identified clinical genomic, and transcriptomic information for patients (pts) diagnosed with AENs (N = 807): mucinous adenocarcinomas (MA) (N = 282), non-mucinous adenocarcinomas (NMA) (N = 311), signet-ring cell carcinoma (SRC) (N = 46), and goblet cell adenocarcinoma (GCA) (N = 168). Pts were stratified by GNAS/KRAS co-mutations (mut) (N = 151) or wild-type (wt) (N = 231). RNA-seq data were normalized and quantified as transcripts per million (TPM) and reported as log2(TPM+1). Immune infiltration was estimated via quanTIseq and enrichment via single sample gene set enrichment analysis (ssGSEA). Real-world overall survival (rwOS) was defined as the time from sample collection to death or loss to follow up. Median OS (mOS) was estimated using Kaplan-Meier curves and
compared using log-rank tests.
Results: Across the cohort, median age was 63 years; 87% were Stage IV with grade distribution of 18% G1, 34% G2, 48% G3; 54% were female; 79% were White, 10% Black, 2% Asian, 8% other and 9% Hispanic ethnicity. Most common mutations across histologies are shown in table 1. In MA and NMA, the most common KRAS alterations were 37% and 25% G12D, 20% and 14% G12V, 7% and 6% G13D, and 5% and 4% G12C. GNAS/KRAS-mut was present in 38% MA, 14% NMA and 7% SRC. Grade 2 MA was genomically more like G1 than G3 with KRAS and GNAS rates for G1/2/3 of 90%/83%/46% and 64%/41%/17%, respectively. In MA pts, mOS was shorter for G3 compared to G2 and G1, respectively (13.2m vs 28.8m vs
25.9m, p = 0.002). Although, immune cell infiltration was similar between MA and NMA pts; pts with GNAS/KRAS-mut showed higher levels of M1 macrophages (p < 0.05), higher enrichment in the tertiary lymphoid structure signature (p < 0.001) and lower levels of M2 macrophages (p < 0.0001) and NK cells (p < 0.0001) compared to wt pts. mOS was improved in GNAS/KRAS-mut (N = 307) pts compared to wt pts (20.5m vs 16m, p = 0.008).
Conclusions: AENs show unique DNA alterations by histological subtype. Grade 2 MA closely resembles G1, not G3, in survival and genomics, supporting a three-tier grading system over a high-grade (G2/G3) grouping. KRAS G12D represented 37% of KRAS mutations, and pts with KRAS/GNAS co-mutations had better survival and a favorable immune profile, supporting further immunotherapy research in low-grade MA.
Table 1. Most common mutations across histological subtypes*