Background: Adults with congenital heart disease (ACHD) frequently develop diffuse myocardial remodeling, particularly of the right ventricle (RV). In patients with repaired tetralogy of Fallot (rTOF), right ventricular remodeling occurs due to myocyte hypertrophy and diffuse interstitial fibrosis (1). CMR with T1 mapping can differentiate between cellular and extracellular components (2). The purpose of this study was to calculate indexed total extracellular volume (iECV) and cellular volume (iCV) using CMR T1 mapping in rTOF and healthy control participants. We hypothesized that rTOF participants would have higher iECV values than healthy control participants.
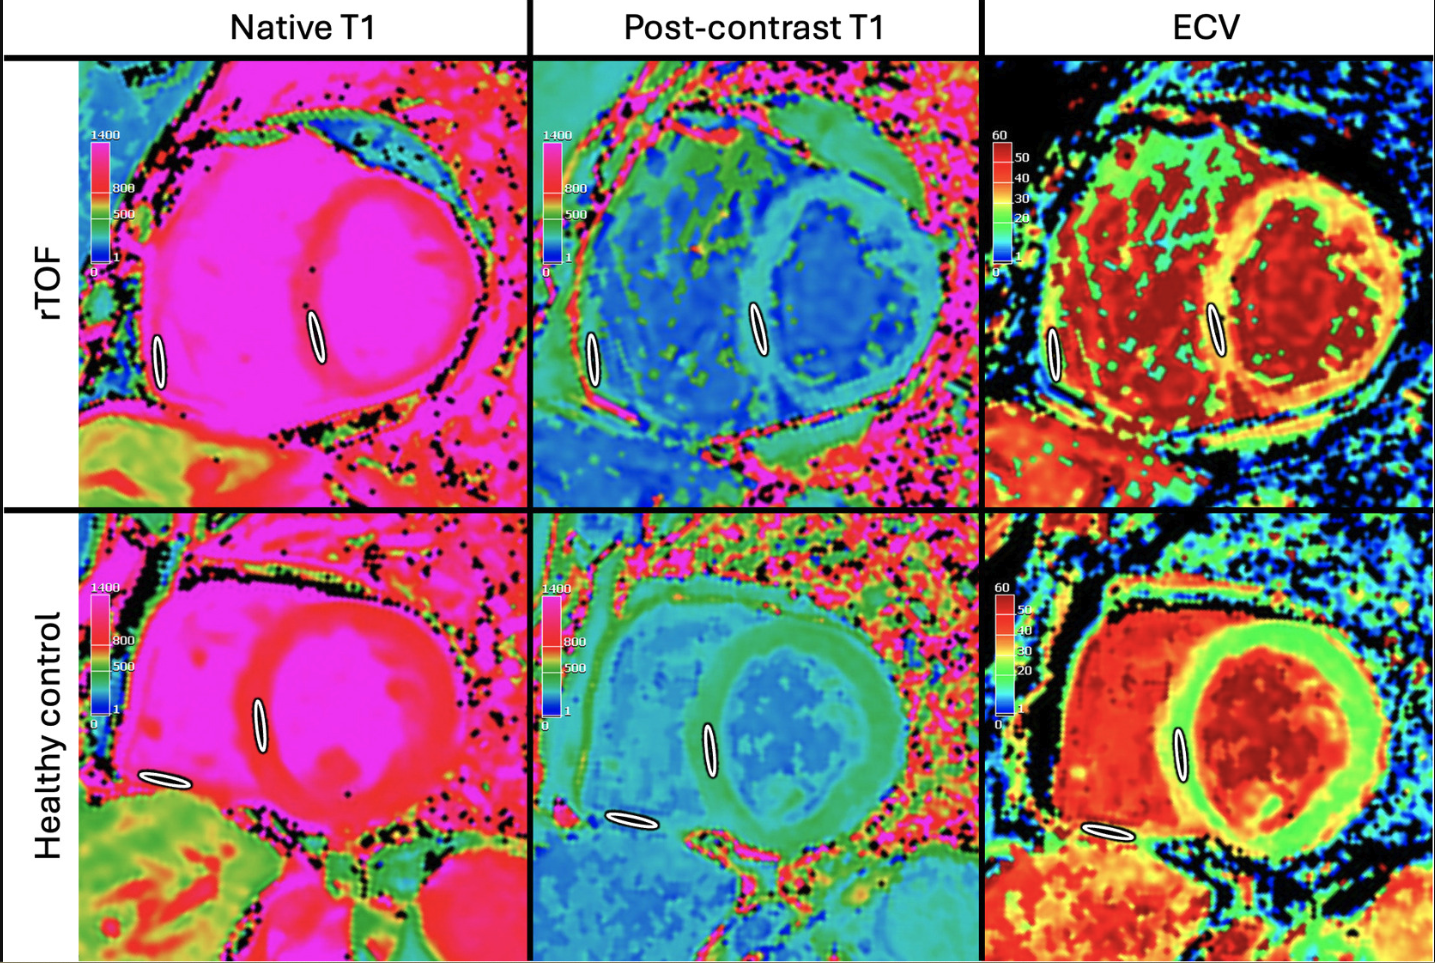
Methods: rTOF and healthy control participants were prospectively enrolled according to an IRB-approved and HIPAA compliant protocol. CMR was performed on a 1.5T scanner (GE 450w, GE HealthCare, Waukesha, WI) and included standard cine balanced steady-state free precession and T1 mapping (MOLLI) before and after administration of gadolinium-based contrast agent (gadobutrol, Bayer HealthCare, Whippany, NJ). CMR analysis was performed using cvi42 (Circle Cardiovascular Imaging, Calgary, Canada) for ventricular volumetric and mass quantification and Tempus Pixel (Tempus, Chicago, IL) for T1 mapping analysis (Figure 1). Serum hematocrit was used for ECV calculation. The ECV was used to calculated the indexed total extracellular volume and the indexed total cellular volume for the right and left ventricles. Indexed total extracellular volume (iECV)=(ECV×LVMindex)/1.05 and indexed total cellular volume (iCV)=((1-ECV)× LVMindex)/1.05, where, LVMindex = LV mass/BSA (2). Tissue characterization parameters were compared between rTOF and healthy control participants using Mann–Whitney U tests.
Results: A total of 13 rTOF (6F/7M) and 17 healthy control (13F/4M) participants were included. The data are summarized in Table 1. No significant differences were observed in LV parameters. Several RV volumetric parameters were significantly different between rTOF and healthy control volunteers. Notably, although RV ECV was not significantly different between the groups, iECV and iCV were significantly higher in the rTOF group than the healthy control group.
Conclusion: Adults with congenital heart disease including rTOF, exhibit significant right ventricular remodeling (hypertrophy, dilation, and increased extracellular volume) compared with controls. These findings underscore the burden of diffuse myocardial remodeling across both ventricles in ACHD. Quantification of indexed total extracellular volume (iECV) and indexed total cellular volume (iCV) provide additional insights into the components of RV remodeling in rTOF patients. The results from this study highlight disproportionate RV hypertrophy and extracellular matrix expansion compared with controls, reinforcing the importance of targeted surveillance in this ACHD subgroup.
| Metric | rTOF Mean | rTOF SD | rTOF Min | rTOF Max | Healthy Control Mean | Healthy Control SD | Healthy Control Min | Healthy Control Max | p-value |
| BSA (m²) | 1.91 | 0.19 | 1.59 | 2.20 | 1.78 | 0.26 | 1.40 | 2.40 | 0.13 |
| Weight (kg) | 77.52 | 10.92 | 58.60 | 90.00 | 68.61 | 15.31 | 48.00 | 107.00 | 0.09 |
| Hematocrit | 42.82 | 4.73 | 37.20 | 54.51 | 40.81 | 3.09 | 34.50 | 46.40 | 0.17 |
| Right Ventricle | |||||||||
| End-Diastolic Volume Index (ml/m²) | 115 | 37 | 55 | 158 | 86 | 13 | 54 | 110 | 0.01 |
| End-Systolic volume Index (ml/m²) | 64 | 25 | 27 | 111 | 38 | 9 | 21 | 54 | 0.00 |
| Stroke Volume Index (ml/m²) | 51 | 15 | 28 | 74 | 47 | 7 | 33 | 57 | 0.29 |
| Ejection Fraction (%) | 46% | 7% | 30% | 55% | 55% | 6% | 42% | 67% | 0.00 |
| Mass Index (g/m²) | 20 | 5 | 11 | 27 | 13 | 3 | 6 | 18 | 0.00 |
| Indexed Total Extracellular Volume (iECV) | 6.9 | 2.1 | 3.1 | 10.0 | 5.0 | 2.1 | 2.6 | 8.3 | 0.04 |
| Indexed Total Cellular Volume (iCV) | 12.5 | 4.2 | 7.2 | 20.0 | 7.1 | 2.8 | 2.9 | 14.0 | 0.00 |
| Extra-Cellular Volume Fraction (%) | 37% | 9% | 23% | 55% | 41% | 12% | 17% | 68% | 0.27 |
| Left Ventricle | |||||||||
| End-Diastolic Volume Index (ml/m²) | 78 | 20 | 56 | 118 | 81 | 14 | 57 | 106 | 0.70 |
| End-Systolic volume Index (ml/m²) | 35 | 18 | 20 | 84 | 33 | 8 | 23 | 52 | 0.70 |
| Stroke Volume Index (ml/m²) | 43 | 9 | 31 | 60 | 47 | 7 | 34 | 57 | 0.16 |
| Ejection Fraction (%) | 57 | 10 | 29 | 68 | 59 | 5 | 49 | 68 | 0.54 |
| Mass Index (g/m²) | 51 | 12 | 39 | 83 | 48 | 9 | 36 | 66 | 0.44 |
| Indexed Total Extracellular Volume (iECV) | 14.8 | 4.5 | 10.8 | 25.8 | 13.3 | 2.7 | 8.4 | 18.2 | 0.29 |
| Indexed Total Cellular Volume (iCV) | 28.7 | 15.2 | 0.0 | 53.2 | 32.5 | 7.0 | 24.1 | 46.7 | 0.38 |
| Extra-Cellular Volume Fraction (%) | 30% | 4% | 24% | 38% | 29% | 4% | 22% | 36% | 0.34 |