-
PROVIDERS
Watch now
Are you getting the full picture? A webinar series on the power of comprehensive intelligent diagnostics
-
LIFE SCIENCES
ENROLL NOW
Tempus’ Patient-Derived Organoid ScreensEvaluate the efficacy of your preclinical compounds using fixed organoid panels designed for diverse therapeutic applications.Space is limited — enroll by June 30, 2025, to secure your spot.
-
PATIENTS
It's About Time
View the Tempus vision.
- RESOURCES
-
ABOUT US
View Job Postings
We’re looking for people who can change the world.
- INVESTORS
03/25/2024
Robustness of Deep Learning Histogenomic Models to Tissue Area, Tumor Purity, and Scanner Type
USCAP 2024 Annual Meeting
PRESENTATION
Authors
Qiyuan Hu, Kunal Nagpal, Rohan P. Joshi, Yoni Muller, Martin C. Stumpe, Nike Beaubier
Background – Microsatellite instability-high (MSI-H) is a tumor-agnostic biomarker for immune checkpoint inhibitor (ICI) therapy. Previous studies have shown that AI-based imaging predictors can infer MSI status from hematoxylin and eosin (H&E) whole-slide images (WSIs). Deployment of these AI predictors requires characterization of assay operating parameters and specimen requirements. Here, we evaluated the performance robustness of a model trained to predict MSI-H status from H&E WSIs of prostate cancer with respect to tissue area, tumor purity, and scanner type.
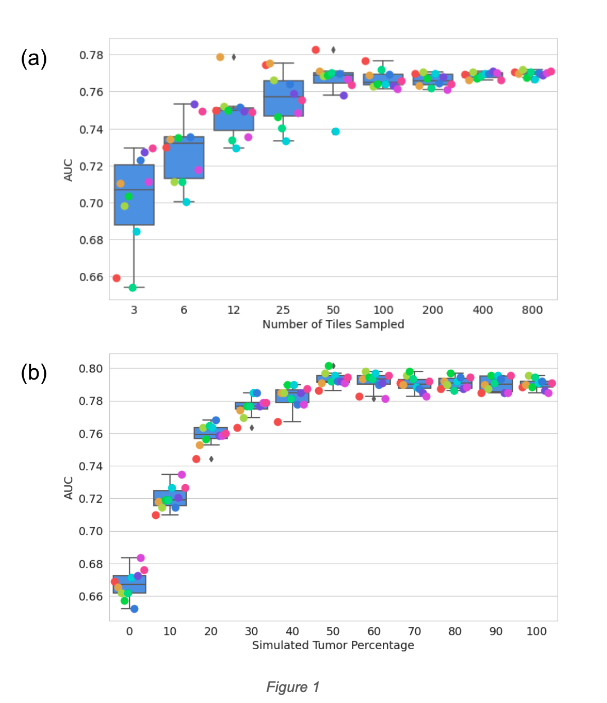
Design – De-identified H&E-stained WSIs of prostate biopsies and surgical resections containing carcinoma were split into a model training set (n=4015, MSI-H 1.8%) and a validation set enriched for MSI-H (n=1523, MSI-H 4.3%). A subset of 1000 slides was scanned on both Aperio GT450 and Philips UFS scanners. Attention-based multiple instance learning models were trained to predict MSI-H status (labels determined via NGS) from H&E WSIs. For tissue area simulations, model inference was run with various numbers of randomly sampled tiles from each slide. For tumor purity simulation, pathologists annotated tumor areas for 60 slides (equal parts of MSI-H and MSS), and different proportions of tumor tiles and stroma tiles were sampled to make up sets of 200 tiles to simulate various tumor percentages. The experiment was repeated 10 times with random samples.
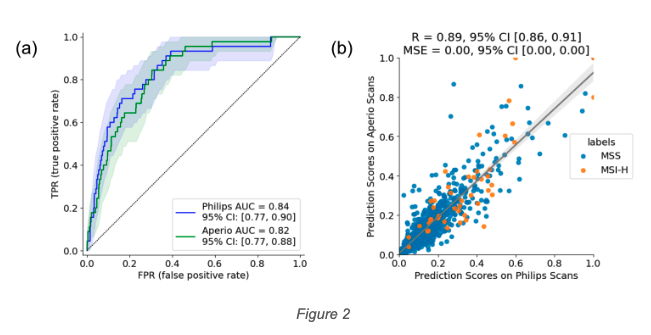
Results – Model performance, as measured by area under the receiver operating characteristic curve (AUC), was robust down to a simulated tissue area of 0.6 mm2, corresponding to 50 tiles (Fig.1a), which is the 0.01 percentile in our dataset and is much smaller than a core needle biopsy. AUC began to decrease for simulated tumor purity below 50% (Fig.1b), which is the 25 percentile in our dataset. Slides scanned by two different scanners yielded similar AUC: 0.84 (95% CI [0.77, 0.90]) and 0.82 (95% CI [0.77, 0.88]) (Fig.2a). Prediction scores of these paired scans also demonstrated high correlation, with Pearson correlation coefficient 0.89 (95% CI [0.86, 0.91]) and mean squared error <0.005 (Fig.2b).
Conclusion – Our histogenomic model is effective for tissue area down to 0.6 mm2, is confident on samples with 50% and higher tumor purity, and is robust to scanner variation. These findings quantify the limit of detection and quality control metrics for the model performance on these sample and image characteristics, establishing a foundation for future deployment of such histogenomic algorithms.
Figures