-
PROVIDERS
New MRD Medicare Coverage for Select Indications*
*When coverage criteria are met. Additional criteria and exceptions for coverage may apply.
-
LIFE SCIENCES
Register now
UPCOMING WEBINAR
Unlocking Foundation Models: Our experience from proof of concept to deploying at scale -
PATIENTS
It's About Time
View the Tempus vision.
- RESOURCES
-
ABOUT US
View Job Postings
We’re looking for people who can change the world.
- INVESTORS
03/24/2025
Validation and Deployment of H&E Image Based Model Predicting Total Nucleic Acid Yield in Multiple Cancer Types
USCAP 2025
PRESENTATION
Authors
Kshitij Ingale, Josh Och, Sun Hae Hong, Kunal Nagpal, Yoni Muller, Kellen Malstrom, Ryan Jones
Background – Next-generation sequencing (NGS) can be instrumental in enabling personalized treatment options for cancer patients. However, a primary reason for NGS testing failures is insufficient total nucleic acid (TNA) yield. In this work, we developed a model to predict TNA yield score from routinely generated H&E slide images. This model was validated on a temporal test set, and is internally deployed to run on NGS samples to support lab workflow. We report robust performance across cancer types and procedure types in both validation and deployment data sets.
Design – The model was trained to predict TNA yield with NGS samples received between Jan – June 2023 using cell count (identified by a deep learning model), sample age, tissue site, and procedure type. Predicted TNA yield was compared to a DNA sequencing quantity-not-sufficient (QNS) binary label and whether TNA yield was over 1000 ng. The threshold to make a prediction on the test set was selected using a separate tuning set (35% randomly selected from the train set) . This model was validated on a temporally held-out set (July-Sept 2023) and evaluated on a post deployment set across multiple cancers and procedure types (July-Aug 2024).
Results – NThe model achieved an AUC of 0.83 for DNA QNS label and 0.89 for TNA > 1000 ng over validation set (Figure 1). PPV was 0.54 for DNA QNS label (prevalence=0.15) and 0.72 for TNA > 1000 ng (prevalence=0.28) (Table 1). Across deployed data, the model yielded an AUC of 0.81 for DNA QNS and 0.89 for TNA > 1000 ng (Figure 1). It attained a PPV of 0.47 for DNA QNS label (prevalence=0.12) and 0.73 for TNA > 1000 ng (prevalence=0.32) (Table 1). The AUC stratified by cancer type and procedure type was robust for both labels. Across all cancer types, AUC was above 0.80 for DNA QNS, and above 0.84 for TNA > 1000 ng label over validation and deployed data. In procedure type subgroups, AUC ranged 0.75 to 0.86 for DNA QNS, and 0.76 to 0.89 for TNA > 1000 ng.
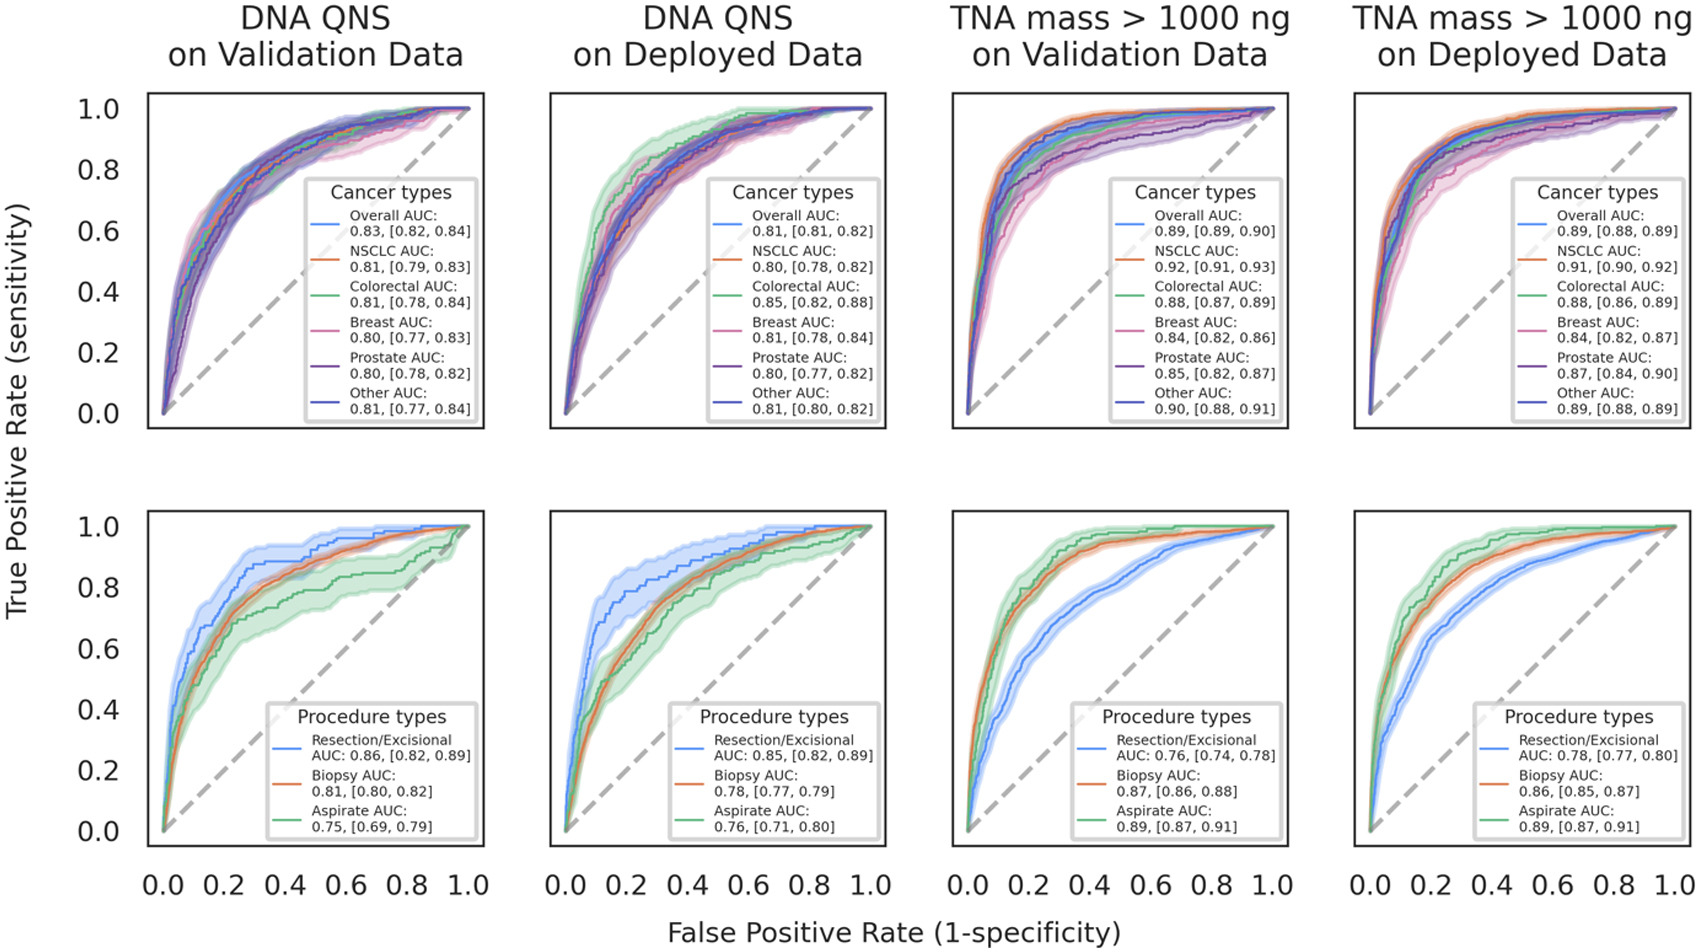
Conclusions – The model exhibits robust performance across cancer types and procedure types, effectively predicting TNA yield in validation and deployment data. It can optimize lab workflows by flagging cases that are likely to fail due to low TNA yield earlier in testing and allow clinicians to send additional samples for sequencing. Furthermore, it can identify cases expected to have excess TNA yields, where fewer slides could be used for sequencing and remaining slides could be leveraged for more targeted assays.