H&E-Based Deep Learning Model Predicts Immune Phenotypes in NSCLC
USCAP 2024 Annual Meeting
Josh Och, M.S., Bolesław Osinski, Ph.D., Sina Zomorrodian, Rohan Joshi, Nike Beaubier, Martin C. Stumpe
Background – Tumor-infiltrating lymphocytes (TIL) are a biomarker for response to immune checkpoint inhibitor (ICI) therapy. However, visually identifying TILs from hematoxylin and eosin (H&E) stained whole-slide images (WSIs) is expensive and time-consuming. Further, a lack of consensus on TIL scoring criteria can result in high levels of pathologist discordance. Here, we use an imaging-based deep learning model to classify H&E WSIs of non-small cell lung cancer (NSCLC) tumors into inflamed (TIL infiltrated) versus non-inflamed immune phenotypes.
Design – H&E stained WSIs (scanned on Leica Aperio GT450) from primary site, resected NSCLC tumors enriched for class balance between inflamed and non-inflamed (n=169, Table I) were assessed by 4 independent pathologists who assigned one of the following labels: inflamed, excluded (stromal TIL infiltrated) or desert (no infiltration). WSIs were randomly split (50:50) into training and testing sets. For model training, one pathologist was held out; each WSI was assigned a ground truth label if 2/3 of remaining pathologists agreed. Previously developed deep learning models were used to count the number of lymphocytes in tumor and stroma regions in 1 mm2 tiles. WSIs were called “inflamed” if enough tiles (slide threshold) had a sufficient number of lymphocytes within tumor regions (tile threshold). Tile and slide-level thresholds were tuned to maximize the F1 score for separation of inflamed and non-inflamed (either excluded or desert) cases in the training set. Model performance was assessed on the independent held-out test set and compared to calls from the held-out pathologist. This process was repeated 4 times, holding out each pathologist.
Results – Overall, our deep learning model achieved a mean of 77.5% accuracy (95% CI 73.3% – 81.7%), which was indistinguishable from that of the held-out pathologists (mean 80.3%, 95% CI 69.0% – 91.6%). Cohen’s kappa coefficient for the model (mean 45.4%, 95% CI 34.9% – 55.9%) was also indistinguishable from that of the held-out pathologists (mean 49.2%, 95% CI 25.3% – 73.0%). A representative comparison of the model to a held out pathologist is shown in Fig.1.
Conclusions – Our deep learning model performed as well as a held-out pathologist for separating inflamed vs. non-inflamed samples. Future work includes extending our model to predicting excluded vs. desert phenotypes, identifying tertiary lymphoid structures, and validating that model predictions are relevant for therapy response.
Figure 1
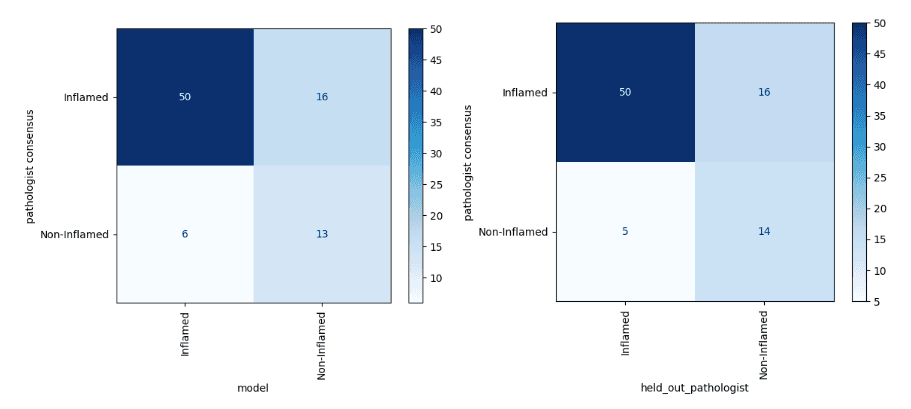
Table 1
| Characteristic | Value | Samples | Percent Inflamed (defined by majority of three pathologists) | Chi-square p-value |
| Stage | Stage 1 | 48 | 77% | 0.018 |
| Stage 2 | 54 | 85% | ||
| Stage 3 | 50 | 64% | ||
| Stage 4 | 17 | 53% | ||
| Grade Rollup | Low Grade | 105 | 70% | 0.204 |
| High Grade | 64 | 80% | ||
| Histology | Adenocarcinoma | 86 | 71% | 0.681 |
| Acinar Cell Carcinoma | 50 | 74% | ||
| Mucinous Adenocarcinoma | 33 | 79% |